

Effective inventory management is vital for any business seeking to optimize costs and ensure smooth operations. One of the most effective techniques to achieve this is ABC analysis. Rooted in the principles of prioritization, ABC analysis categorizes inventory items into three groups (A, B, and C) based on their importance. This method allows businesses to focus their efforts on high-value items while still maintaining control over less critical inventory. This provides benefits in reducing carrying costs, avoiding stockouts, and minimizing waste. In this article, we will delve into the concept of ABC analysis, explore its connection to the Pareto Principle, guide you through its implementation and utilization within inventory management, and even touch on how it can help you get more out of inventory management software like PrismHQ.
If you’re looking to dive right in, we’ve got you covered with a FREE Inventory Management Google Sheet template.
Understanding the Pareto Principle
The Pareto Principle, often referred to as the 80/20 rule, was introduced by Italian economist Vilfredo Pareto in the late 19th century. Pareto observed that 80% of Italy’s wealth was owned by 20% of the population, a pattern he later found in other areas of life. This principle has since been widely applied in business and economics to illustrate how a small percentage of causes often account for a large percentage of effects.
Here are a few more modern-day examples of the 80/20 rule:
- Business Revenue: 80% of a company’s revenue often comes from 20% of its customers.
- Product Sales: 20% of products typically generate 80% of total sales for retailers.
- Software Bugs: 80% of software problems are caused by 20% of the bugs.
- Time Management: 20% of tasks often account for 80% of productivity.
- Health and Fitness: 20% of exercises or activities lead to 80% of fitness improvements.
In many different facets of life, we can find this uneven distribution holds true. Recognizing that some things are more valuable or impactful than others, means we can focus energy and resources on the right things.
From the Pareto Principle to ABC Analysis
In inventory management, the Pareto Principle serves as the foundation for ABC analysis. By applying the 80/20 rule, businesses recognize that a small fraction of inventory items (approximately 20%) accounts for the majority (around 80%) of the overall value or impact. This insight allows organizations to prioritize resources and decision-making efforts on the most significant items while systematically managing the rest.
Related: Inventory Waste: How to Plug the 5 Most Common Leaks Drowning Your Profitability
What Is ABC Inventory?
ABC inventory categorization divides stock into three distinct groups:
- A Items: High-priority items that account for the majority of the inventory value.
- B Items: Moderately important items that balance value and volume.
- C Items: Low-priority items that contribute the least to overall value but often make up the largest quantity.
This classification helps businesses allocate resources effectively, ensuring that critical items receive the most attention. Here’s how each group is managed:
A Items
Category A includes high-value, low-quantity items that are crucial to operations. These items typically constitute 70-80% of the inventory value but may represent only 10-20% of the total inventory. Examples include expensive machinery parts or high-demand finished goods.
Due to their significance, A items require close monitoring, frequent reviews, and robust demand forecasting. Businesses often apply rigorous controls to ensure availability, including frequent stock reviews, precise demand forecasting, and tight security measures. Stockouts of A items can have a severe impact, so they are closely monitored and restocked promptly.
B Items
B items lie in the middle of the spectrum, balancing value and quantity. These items usually make up 15-25% of the inventory value and 30-40% of the total items. Examples include mid-range components or moderately priced goods with steady demand.
While B items do not require the same level of attention as A items, they still benefit from regular monitoring and efficient reorder systems. Inventory systems might use predictive analytics to maintain optimal stock levels without overinvesting in these items.
C Items
C items are low-value, high-quantity items that contribute just 5-10% to the inventory’s value but take up significant space. These items might include office supplies, spare parts, or bulk raw materials.
Although they require minimal oversight, businesses should ensure that C items do not become obsolete or clutter storage spaces unnecessarily. Management strategies focus on cost efficiency, such as bulk ordering, less frequent stock reviews, and simplified tracking. While C items require less oversight, ensuring they do not accumulate excessively is essential to avoid wasted storage space and resources.
How to Calculate ABC Inventory
Implementing ABC analysis involves a systematic approach. Here’s a step-by-step guide:
Collect Inventory Data
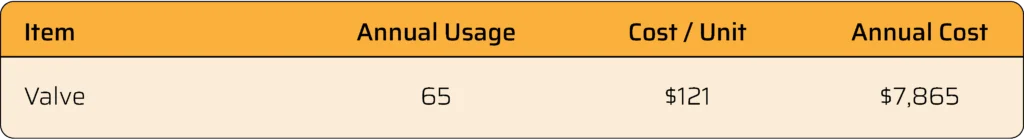
Gather data on all inventory items, including quantities, unit costs, and annual cost values. For example, if a valve has an annual usage of 65 units and costs $121 per unit, its annual cost value is $7,865.
Calculate Annual Cost Values
For each item, multiply the annual usage by its unit cost. This will give you the total cost value for each product. Repeat this for all inventory items.
Rank Items by Value
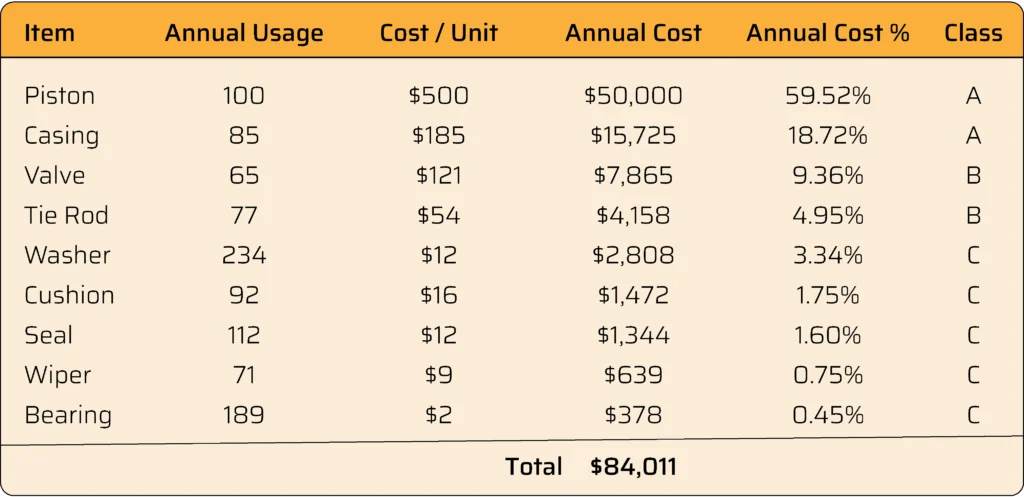
Organize inventory items in descending order of their consumption values. For instance, if a Piston has the highest annual value of $50,000, it ranks first.
Determine Cumulative Percentages
Calculate the cumulative percentage for each item’s value and quantity. For example, if Item X accounts for 30% of total inventory value, add it to the percentages of subsequent items to build a cumulative chart.
Classify Items into A, B, and C Categories
Based on the cumulative percentages, classify items:
- A Items: Top 70-80% of value
- B Items: Next 15-25% of value
- C Items: Remaining 5-10% of value
Using ABC Analysis in Inventory Management
ABC analysis can significantly enhance inventory management processes. Here’s how:
1. Prioritize High-Value Items: Devote more resources and monitoring to A items to ensure their availability.
2. Optimize Inventory Levels: Maintain sufficient stock of B items without overstocking.
3. Streamline Low-Value Items: Minimize holding costs for C items while avoiding stockouts.
4. Improve Decision-Making: Focus managerial efforts on high-impact areas.
5. Enhance Forecasting: Use demand data to improve predictions for A and B items.
6. Reduce Waste: Identify and phase out obsolete C items.
7. Increase Efficiency: Allocate resources and storage space based on item priority.
Conclusion
ABC analysis is a powerful tool that aligns inventory management efforts with business priorities. By classifying items into A, B, and C categories, businesses can focus on high-value items, optimize operations, and reduce costs. When combined with inventory management software, ABC analysis can provide even greater insights, help inform decision making for reorder points, SKU formatting, automation, and ordering. Adopting this approach can transform how businesses manage their inventory, ensuring both efficiency and profitability.
We Can Help
If you’re ready to take the first steps towards a faster and easier way to manage your business, PrismHQ provides a simple and flexible solution to streamline inventory management, increase visibility, and improve communication across departments. Our mission is to serve growing manufacturers by providing a single, affordable solution that automates inventory management and integrates it with daily business processes for increased productivity and lower overhead. Contact us today to learn more!
What should I do now?
Below are three ways you can continue your journey to increase efficiency and boost growth at your company:
Download our free Technology Assessment and see if you’ve outgrown your current technology and processes.
Follow us on LinkedIn, Facebook, and X (Twitter) for bite-sized insights on manufacturing technology, software, processes, and more.